The Telecom Bubble Analogy Is Half Right
Why the AI infrastructure debate is asking the wrong question
The comparison arrives reliably. Whenever AI capital expenditure figures cross a new threshold, a chorus of analysts reaches for the same historical parallel: the telecom crash of 2000 to 2002. Hyperscalers are committing hundreds of billions of dollars to GPU clusters and data centers ahead of proven demand, the argument goes, and we have seen this movie before.
The sceptics are not fringe voices. Sequoia Capital partner David Cahn identified a $600 billion gap between the revenue required to justify current AI infrastructure spending and what the industry is actually generating. Goldman Sachs published a widely-cited analysis questioning whether AI could deliver a return on the capital being deployed. These are serious observations from credible sources.
But the analogy, while useful as a starting point, breaks down in two structural ways that most of the bubble commentary misses. The first is about the economics of the infrastructure itself. The second is about the nature of the demand it serves. Understanding both changes the question worth asking.
I. What the Analogy Gets Right
The surface similarities are real and should not be dismissed. Between 1996 and 2001, US telecom companies issued more than $500 billion in bonds to fund a frenzied buildout of fiber optic networks. The investment was premised on projections of internet traffic growth that proved, in the near term, wildly optimistic. By 2001, an estimated 95 percent of newly laid fiber sat unused, earning it the name "dark fiber." Global Crossing declared bankruptcy in 2002 with $12.4 billion in debt. WorldCom followed in what became the largest accounting fraud in US history. The industry had accumulated over a trillion dollars in debt, most of which was written down.
Today's figures rhyme uncomfortably. The four major hyperscalers (Microsoft, Amazon, Alphabet, and Meta) have guided toward a combined $635 to $690 billion in capital expenditure for 2026, a 67 to 74 percent increase over 2025. Goldman Sachs projects $5.3 trillion in combined hyperscaler capex between 2025 and 2030. Nvidia's data center revenue reached $75.2 billion in a single quarter. These are numbers that, in isolation, could easily anchor a bubble narrative.
The concern is not unreasonable. But it focuses on the scale of the investment rather than the mechanism that made the telecom crash so severe. Those two things are different.
II. The Mechanism That Made the Telecom Crash Catastrophic
The telecom bust was not simply the result of overinvestment. Many capital cycles involve overinvestment without producing the kind of systemic collapse that the telecom era did. What made it particularly destructive was a specific property of the infrastructure itself: once fiber was in the ground, the marginal cost of carrying another packet of data was essentially zero.
This matters because it severed the connection between supply and demand in a way that normal capital cycles do not. When serving an additional unit of demand costs nothing, pricing collapses toward zero and there is no mechanism to signal that capacity has been overbuilt. Bandwidth became a commodity almost immediately. Revenue per unit of traffic fell faster than traffic grew. Companies that had taken on enormous debt to build infrastructure found that the infrastructure generated less revenue the more it was used, not more.
"By 2001, an estimated 95 percent of newly laid fiber sat unused. The marginal cost of using it was essentially zero. That is what collapsed the pricing."
A secondary mechanism compounded the problem: vendor financing. Cisco, Lucent, and Nortel did not simply sell equipment to telecom companies. They lent them the money to buy it. Lucent committed $8.1 billion in customer loans, Nortel $3.1 billion, and Cisco over $2.2 billion, before writing off $900 million in defaults when demand evaporated. The effect was to inflate demand signals artificially. Companies were buying with borrowed money from the same companies selling them the equipment, creating a circular loop that masked the absence of genuine end demand until it was too late.
Together, these two dynamics (zero marginal cost and circular vendor financing) produced a crash that was disproportionate to the overinvestment itself. The infrastructure did not just lose value; it became nearly worthless, because there was no floor to what it cost to provide the service.
Observers who draw the AI parallel today are largely pointing at the investment scale. Fewer are asking whether these specific mechanisms are present. They are not, or at least not in the same form.
III. Why AI Infrastructure Economics Are Different
The core difference is that AI compute has a real and persistent marginal cost per unit of usage. Every inference, every query, every agent step consumes GPU time, electricity, cooling, networking, and the depreciation of expensive hardware. Inference now accounts for an estimated 60 to 70 percent of total AI compute demand across major hyperscalers, up from roughly 40 percent in 2024. For most companies deploying AI, inference represents 80 to 90 percent of total AI lifetime costs.
This non-zero marginal cost does something the fiber buildout never had: it keeps supply and demand structurally coupled. When providing service to one more user costs something real, pricing cannot collapse indefinitely toward zero without destroying the economics of the provider. Utilization of infrastructure shows up immediately in the cost structure. Overbuilding is visible in unit economics rather than hidden in accounting.
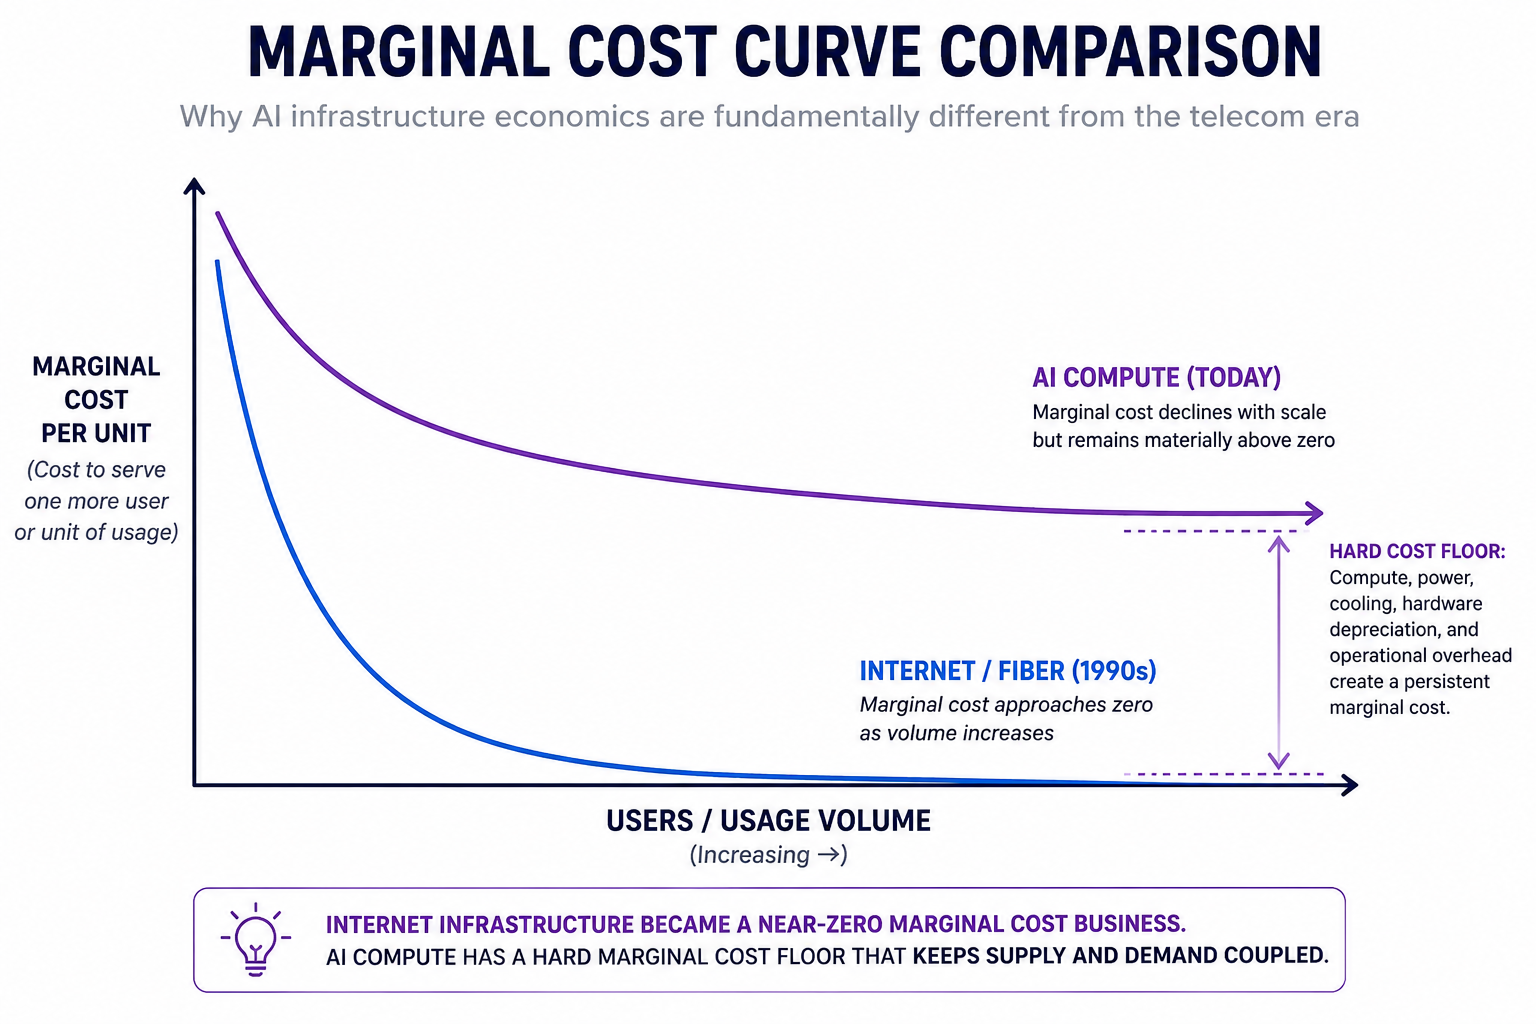
This does not mean AI infrastructure is immune to competitive pricing pressure. Nvidia currently captures approximately 75 percent gross margins on its data center chips, which is precisely why every major hyperscaler is investing in proprietary silicon (Google's TPUs, Amazon's Trainium, Meta's MTIA) to reduce their dependence on a single supplier and drive down their per-token costs. Prices will continue to fall. But there is a physics-constrained floor to how far they can fall, set by the actual cost of compute, power, and hardware depreciation. That floor did not exist for fiber.
The circular vendor financing dynamic also looks different in the current cycle. While observers have drawn comparisons between Nvidia's investment in AI startups and Cisco's vendor financing during the telecom era, the key distinction is that AI startups are generating real inference revenue from the compute they purchase, rather than simply swapping capacity with each other. The loop exists but it is not yet hollow.
IV. The Demand Case Is Structurally Stronger
The second way the analogy breaks down is more important and more underappreciated. The telecom bubble was premised on demand for bandwidth. Bandwidth is a means to an end: you needed it to reach the internet, to send email, to stream video. The demand case for bandwidth was essentially the demand case for internet connectivity, which proved real but slower to materialize than the infrastructure build implied.
AI compute is different in kind. It is not a conduit to something else. It is directly productive across an enormous range of tasks: coding, writing, analysis, customer service, legal research, medical diagnosis, scientific modeling, software testing. The surface area of potential demand is broader, more diverse, and less dependent on any single application category materializing on a specific timeline.
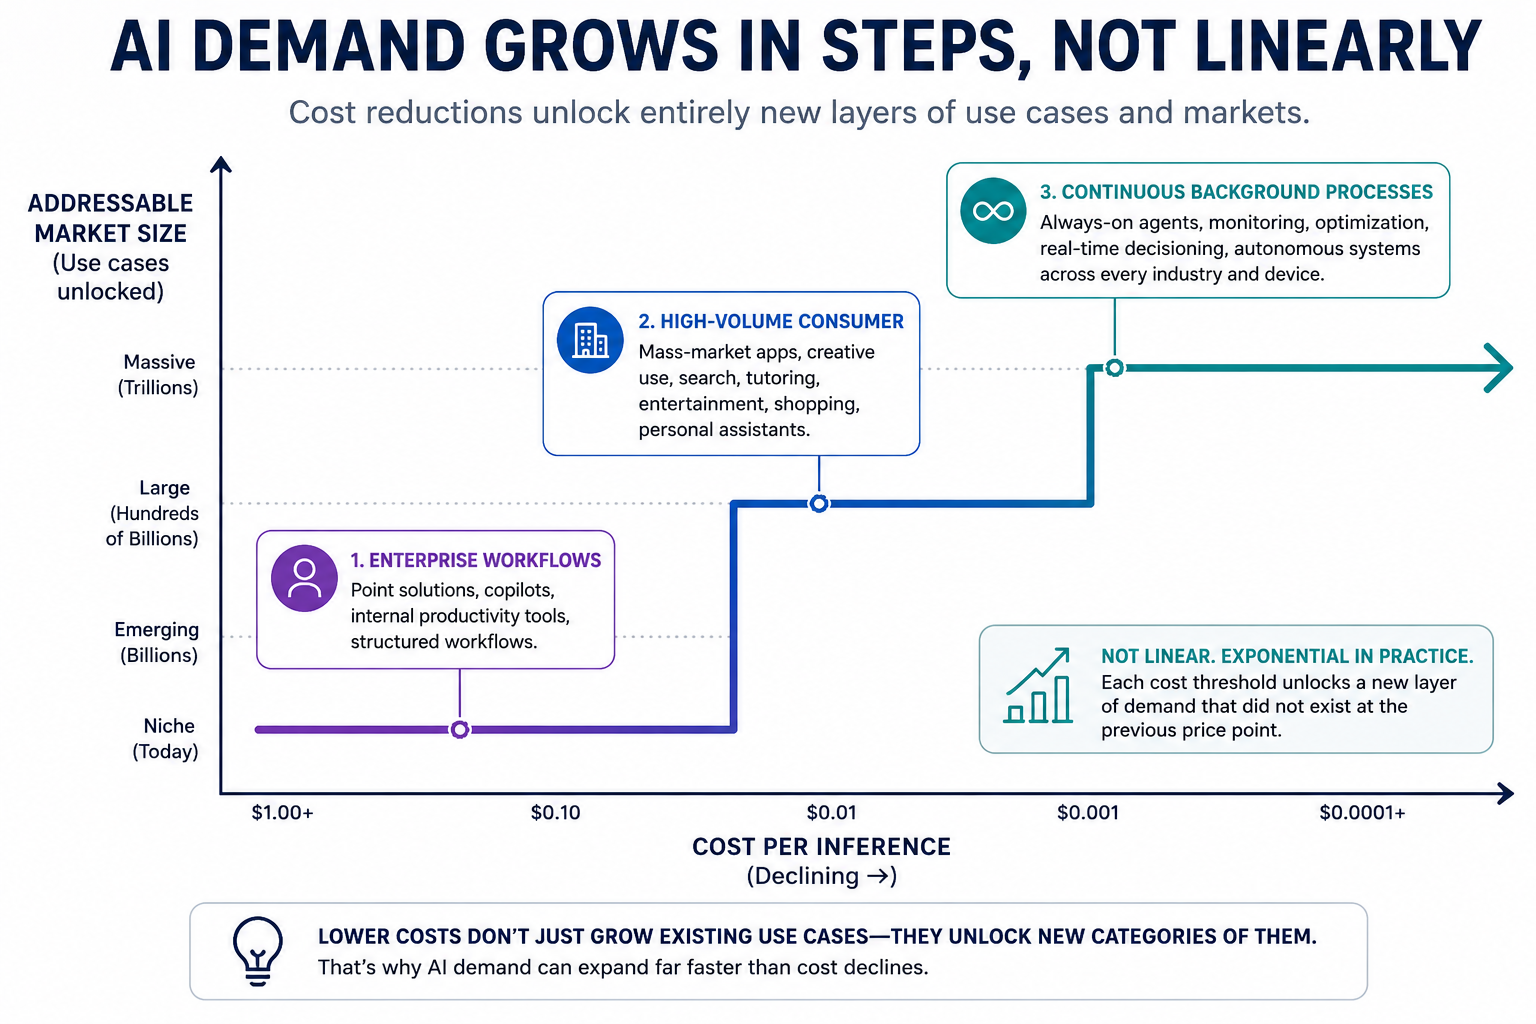
More importantly, the relationship between cost and demand in AI is non-linear in a way that bandwidth demand was not. As inference costs fall, they do not simply produce more of the same use cases at lower prices. Each significant cost reduction crosses thresholds that unlock categories of demand that did not economically exist at the prior price point. This is the Jevons Paradox applied to intelligence: efficiency gains tend to expand total consumption rather than reduce it, because lower costs make previously uneconomical applications viable.
The historical precedent for this pattern is strong. When the price of artificial light fell 3,000 times over two centuries, per-capita consumption of light did not stay flat. It rose 13,000 times, as lower costs enabled uses that candlelight made impractical. When semiconductor efficiency improved under Moore's Law, it did not reduce total energy use in computing. It expanded it, because cheaper compute enabled applications that more expensive compute could not support. The same dynamic is already visible in AI pricing.
GPT-4 launched in March 2023 at $30 per million tokens. By October 2024, a model matching GPT-3.5 performance cost $0.07 per million tokens, a reduction of roughly 280 times in less than two years. This compression has already unlocked application categories that did not exist at prior price points: AI coding assistants at consumer scale, real-time voice agents, always-on document analysis, embedded AI in mobile applications. Each threshold crossed opened a new layer of addressable market.
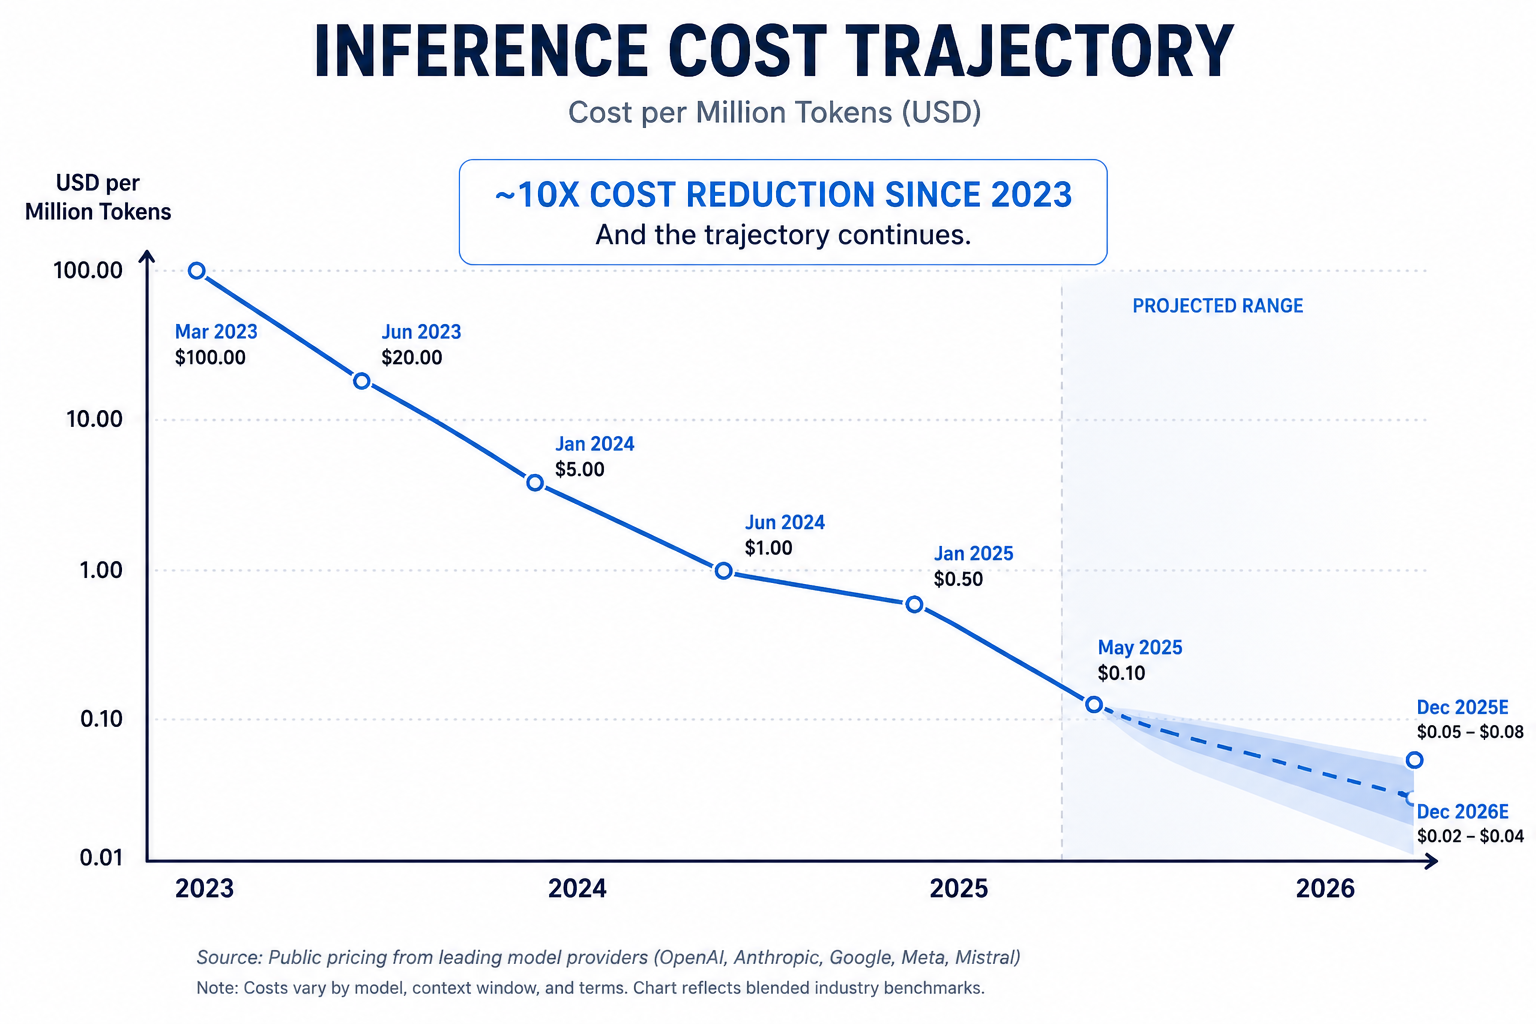
Inference costs are projected to continue falling, reaching $0.02 to $0.04 per million tokens for frontier-class models by the end of 2026. At those price points, use cases that currently require human intervention for cost reasons (continuous background monitoring, real-time multimodal analysis, and always-on personal agents) become economically viable at scale. The demand expansion is not incremental. It is categorical.
V. The Agentic Multiplier
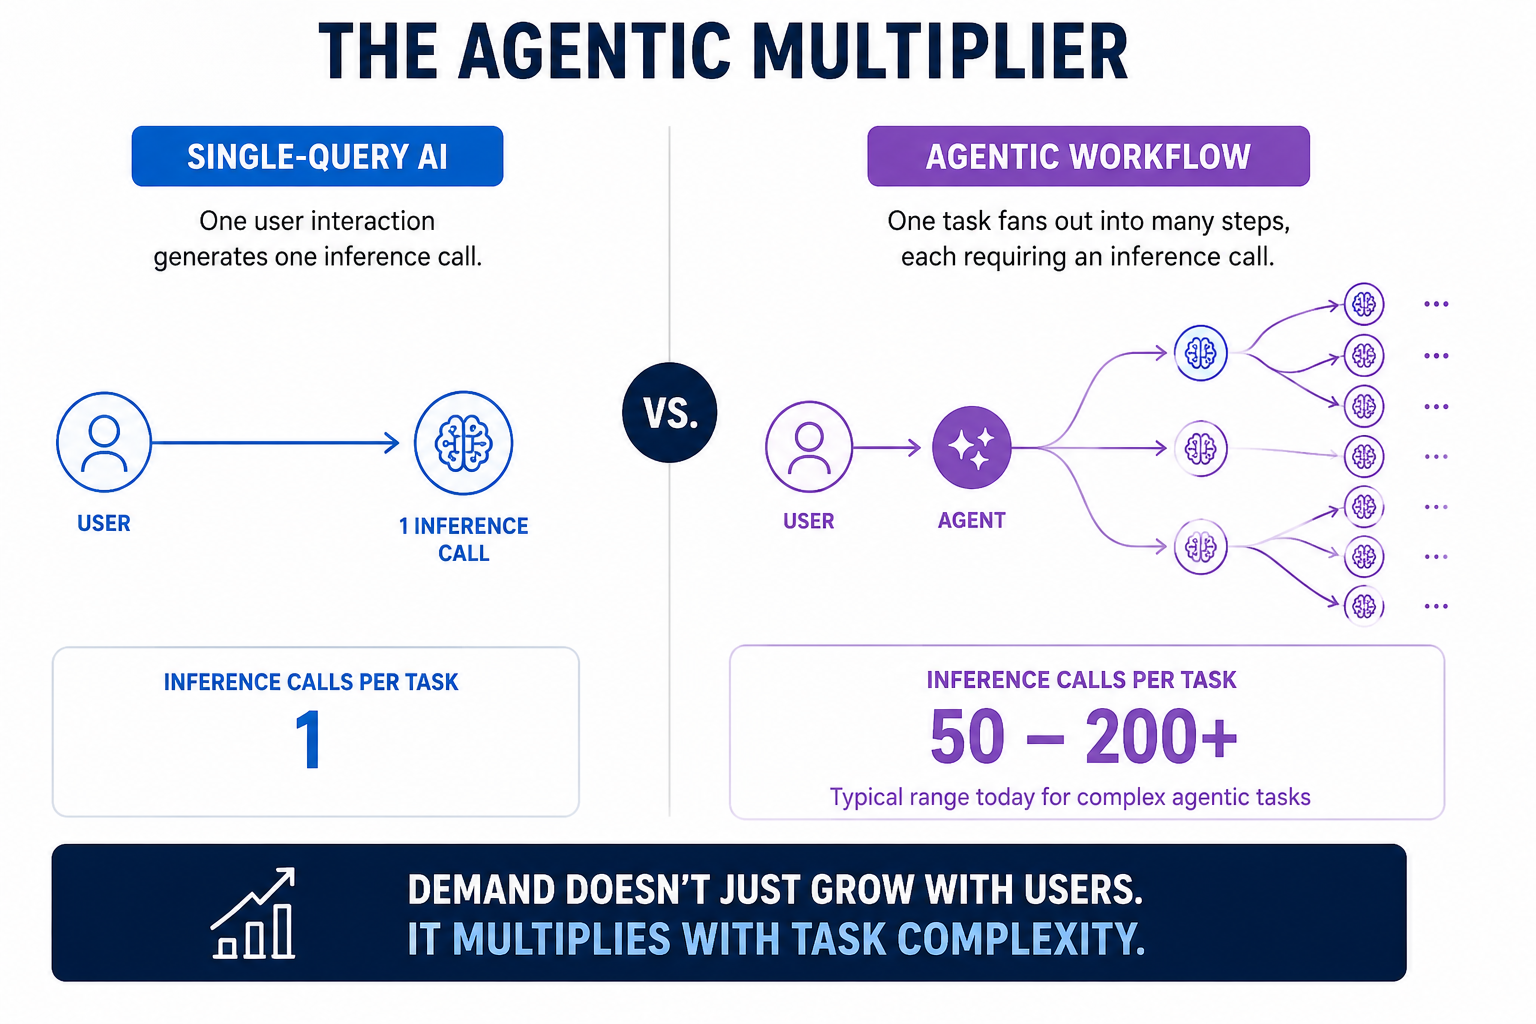
There is a further demand dynamic that has no telecom parallel at all: the emergence of agentic AI. Single-query interactions, where a user asks a question and receives a response, represent only the earliest form of AI deployment. The industry is shifting rapidly toward agentic workflows in which an AI system completes multi-step tasks autonomously, calling tools, making decisions, verifying outputs, and iterating across many steps before delivering a result.
The inference demand implications are significant. A single-query interaction generates one inference call. A complex agentic workflow completing a task such as researching a competitive landscape, drafting a contract, or debugging a software system may generate 50 to 200 or more inference calls per task completion. As enterprise AI adoption moves from assistants to agents, inference demand per user does not grow incrementally. It multiplies.
Enterprise adoption of agentic AI is still in early stages. Most large organizations are in pilot or limited deployment phases. The shift from copilot-style tools to fully autonomous agents across knowledge work represents a demand expansion that is difficult to model from current usage data, but whose direction is clear.
Telecom demand scaled with the number of users. AI demand scales with users multiplied by task complexity multiplied by the degree of autonomy granted to agents. These are different compounding curves.
VI. Where the Risk Actually Lives
None of this means the risks are absent. They are real. They are simply different from the risks that produced the telecom crash, and conflating them produces incorrect analysis.
The most legitimate concern about the current AI buildout is a timing risk rather than a structural one. "Demand will come" was also true of fiber. It did come: the bandwidth capacity built in the late 1990s was being heavily utilized by 2006 to 2008, as broadband penetration, streaming video, and smartphone internet access scaled. The investors who built that infrastructure were right about the technology and wrong about the timeline. That is a materially different failure mode from what the bubble narrative implies, but it is still a failure mode that destroys capital.
There is also a distinction within the current capex cycle that the aggregate numbers obscure. Most of the capital being deployed today is for training frontier models rather than inference. Training economics are different from inference economics: training is closer to fixed-cost R&D than to the ongoing marginal-cost structure that creates demand-supply coupling. A company building a 100,000 GPU cluster to train a frontier model is not subject to the same discipline as a company monetizing inference at scale. The non-zero marginal cost argument applies most cleanly to the inference layer, which is where ongoing costs and ongoing revenues are matched. Training is a different bet.
Finally, non-zero marginal cost does not prevent capital cycles. Airlines, shipping, power generation, and semiconductor manufacturing all have real marginal costs and all experience significant boom-bust cycles driven by overbuilding and demand timing mismatches. The presence of a cost floor does not guarantee rational capital allocation. It does mean that when demand does arrive, the infrastructure generates proportional revenue rather than collapsing into commodity pricing.
VII. The Right Framework for Evaluation
The question of whether AI infrastructure spending constitutes a bubble is less useful than the questions it should be broken into.
The bear case requires believing that agentic AI demand does not materialize at the scale implied by current investment before a critical mass of AI infrastructure providers face debt-service crises. This is plausible but requires a specific failure of the demand-side story: not just slower-than-expected adoption, but adoption so slow that it triggers financing failures before the cycle can self-correct. The circular financing concern that Sequoia's Cahn has raised is the most concrete version of this risk.
The bull case requires believing that the step-function demand expansion described above, combined with the agentic multiplier, produces sufficient revenue growth to justify returns on invested capital within the financing timelines of the current buildout. JPMorgan's December 2025 analysis concluded that AI investment is already linked to actual enterprise revenue rather than speculation alone, which is a meaningful distinction from the telecom era.
The evidence to watch is not primarily the capital expenditure figures. Those are already committed. The leading indicators are enterprise AI adoption rates for agentic workflows, the trajectory of inference revenue relative to infrastructure costs, and the degree to which cost reductions in inference are generating new demand categories rather than simply reducing revenue per unit. So far, the data on all three fronts is more consistent with the bull case than the bear case. But it is early.
Conclusion
The telecom bubble analogy captures something real about the current moment: a massive infrastructure buildout ahead of fully proven demand, with genuine uncertainty about the distribution of returns. That part of the comparison is legitimate.
What it misses is the structural difference in how supply and demand are coupled, and the structural difference in the nature of demand itself. The mechanism that made the telecom crash so severe (zero marginal cost collapsing pricing, decoupling supply from demand, destroying the revenue case for the infrastructure) is not the operative mechanism in AI. And the demand case for AI compute is materially broader, more Jevons-elastic, and more multiply-compounding than the demand case for bandwidth ever was.
This does not mean the investment being made today will be vindicated at projected returns, or on the timelines investors require. It means the nature of the risk is more specific than the bubble narrative implies. The AI infrastructure buildout will not implode under its own weight the way fiber did. The question is whether enough economically valuable workloads emerge, and when.
A more specific risk is a more addressable one. That is a meaningful distinction, and it is the one the telecom analogy keeps obscuring.
Sources
Sequoia Capital, "AI's $600B Question" (David Cahn, June 2024)
Goldman Sachs, "Tracking Trillions: The Assumptions Shaping the Scale of the AI Build-Out" (2025)
Fabricated Knowledge, "Lessons from History: The Rise and Fall of the Telecom Bubble"
Wikipedia, "Telecoms crash" — telecom debt and fiber utilization statistics
TheStreet, "Cisco, Lucent and Nortel: Prime Lenders for the Network Buildout" — vendor financing figures
Tomasz Tunguz, "Circular Financing: Does Nvidia's $110B Bet Echo the Telecom Bubble?" (2024)
TokenCost, "AI Price Index: LLM Costs Dropped 300x (2023-2026)"
Ankur's Newsletter, "The Real Price of AI: Pre-Training vs. Inference Costs" — 280x cost reduction figure
Value Add VC, "Big Tech AI Capex in 2025: Microsoft, Google, Meta, Amazon and the Spending Race"
Goldman Sachs, "Why AI Companies May Invest More than $500 Billion in 2026"
JPMorgan AI infrastructure analysis, December 2025